Ethereum Price Analysis: ETH Rebounds Toward $1,585 as Buyers Test Resistance


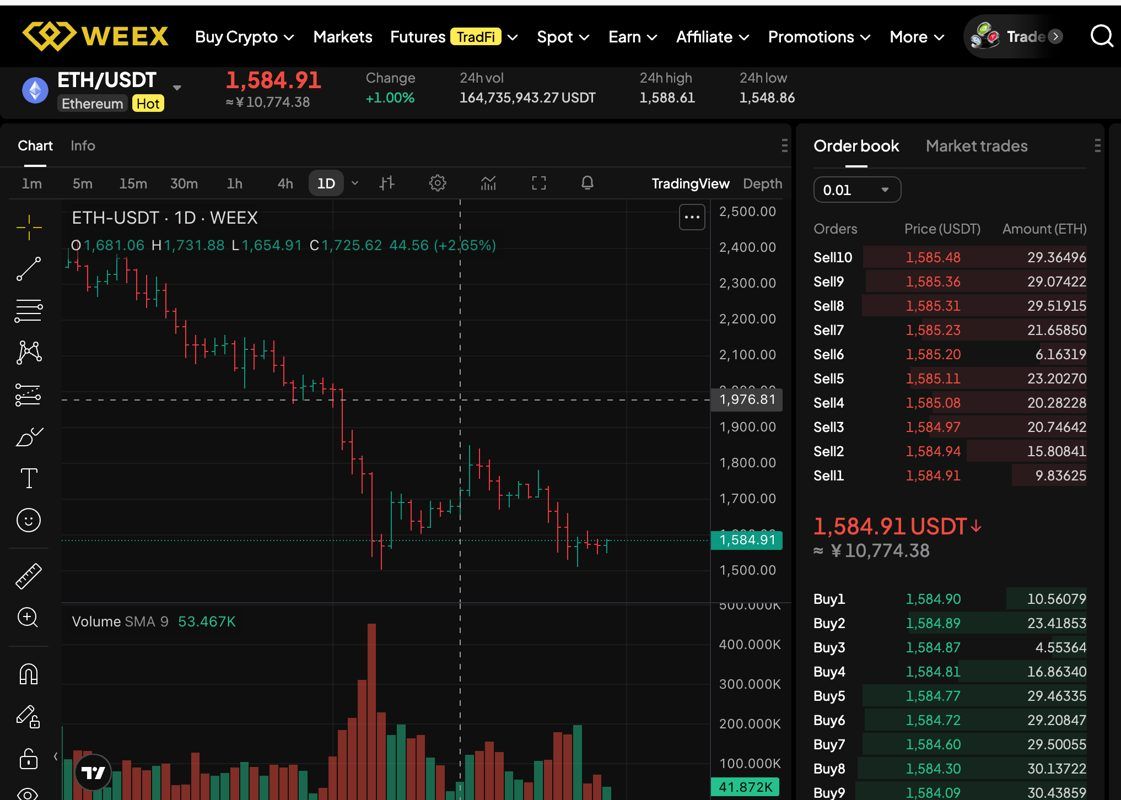
Ethereum is trading near $1,584.91 on the ETH/USDT spot market after a 1.00% 24-hour gain. The latest WEEX market view shows 24-hour volume around 164,735,943.27 USDT, with ETH moving between a low of $1,548.86 and a high of $1,588.61.
The short-term setup is improving, but not fully confirmed. ETH has bounced from the lower end of its recent range, yet the daily chart still shows pressure after a broader decline. Users who want to follow Ethereum markets directly can create a WEEX account and monitor the ETH/USDT spot market as price tests resistance near $1,600.
ETH Market Snapshot
| Item | Current read | Why it matters |
|---|---|---|
| Spot price | $1,584.91 | ETH is trading close to near-term resistance |
| 24h change | +1.00% | Shows a short-term rebound attempt |
| Support zone | $1,548.86 to $1,550 | First area buyers need to defend |
| Resistance zone | $1,588.61 to $1,600 | First area buyers need to reclaim cleanly |
| Market bias | Recovery attempt inside a weak broader trend | ETH needs follow-through before the bounce looks durable |
| Next key level | $1,650 / $1,550 | Upside and downside levels to watch next |
Why ETH Is Moving Today
ETH price is being shaped by a modest rebound from recent lows, stronger short-term buying than the prior session, and a test of the upper side of the 24-hour range. The move above $1,580 shows buyers are active, but the market has not yet cleared the $1,600 area.
The daily chart still matters. ETH remains well below earlier levels on the visible chart, so traders should avoid treating one green move as a full trend reversal. A healthier setup would require stronger closes above resistance and improving volume during upward moves.
Ethereum Recovery Path
A recovery path for Ethereum starts with holding the $1,548.86 to $1,550 support band. If buyers defend that zone and push ETH above $1,588.61, the next test would be around $1,600. A stronger move through $1,600 could bring $1,650 back into focus.
For now, the recovery case needs confirmation. ETH needs sustained buying above resistance, not only a short-term bounce. Traders should watch whether price can hold above $1,580 and whether sellers return quickly near $1,600.
Downside Risk: Can ETH Lose Support?
The bearish case becomes stronger if ETH loses the $1,548.86 support level. A clean break below that area would suggest that the current rebound failed and that sellers are still controlling the broader structure.
If $1,550 breaks, traders may start watching $1,520 and $1,500 as lower downside zones. Another drop could also develop if ETH repeatedly fails near $1,588.61 to $1,600, because failed resistance tests often bring short-term sellers back into the market.
ETH Support and Resistance Map
| Level | ETH price zone | Why it matters |
|---|---|---|
| Immediate support | $1,548.86 to $1,550 | Recent low area and first zone buyers need to defend |
| Near-term resistance | $1,588.61 to $1,600 | Recent 24-hour high and first recovery barrier |
| Bullish extension | $1,650 | Potential upside level if ETH breaks resistance with volume |
| Breakdown watch | Below $1,548.86 | Would weaken the rebound and confirm renewed selling pressure |
ETH Market Data to Watch
| Metric | Current reading | Trader focus |
|---|---|---|
| Spot price | $1,584.91 | Whether ETH can hold above $1,580 |
| 24h change | +1.00% | Shows short-term buying pressure |
| 24h high | $1,588.61 | First level buyers need to reclaim |
| 24h low | $1,548.86 | Key support for the current rebound |
| 24h volume | 164,735,943.27 USDT | Watch whether volume rises during any breakout attempt |
Technical Signals to Check
| Indicator | Current read | What traders should watch |
|---|---|---|
| MACD | Not confirmed from the screenshot | Watch for a bullish crossover before trusting a larger recovery |
| RSI | Not confirmed from the screenshot | Check whether ETH is recovering or still weak near resistance |
| Major support | $1,548.86 to $1,550 | Loss of this zone would favor sellers |
| Major resistance | $1,588.61 to $1,600 | Break above this zone would improve the short-term setup |
ETH Scenario Table
| Scenario | Trigger | Possible ETH reaction |
|---|---|---|
| Bullish recovery | ETH holds $1,550 and breaks above $1,600 | Price may retest $1,650 if volume supports the move |
| Range-bound rebound | ETH stays between $1,548.86 and $1,600 | Short-term traders may focus on support and resistance reactions |
| Bearish breakdown | ETH loses $1,548.86 | Price could test lower support as sellers regain control |
Trader Takeaway
ETH is trying to rebound, but the move still needs confirmation. The setup is stronger than a flat market because price is up on the day, yet buyers still need a clean break above $1,600 before the chart looks meaningfully healthier.
Risk control matters because Ethereum can move sharply around round-number levels. Traders should avoid chasing a single candle, watch order execution around $1,600, and size positions according to the risk of a break below $1,550.
How to Trade Ethereum on WEEX: Step by Step Guide
- Step 1: Go to the WEEX official website and create your WEEX account.
- Step 2: Deposit funds by transferring crypto from your wallet or buying through WEEX Quick Buy.
- Step 3: Go to the spot section and search for the ETH/USDT trading pair.
- Step 4: Enter the amount of ETH you want to buy or sell and place your order.
- Step 5: Secure your Ethereum. You can move ETH to your own wallet or keep it on WEEX only for active trading.
Bottom Line
Ethereum is in a short-term recovery attempt, but the broader chart still looks cautious. ETH is holding above the $1,548.86 to $1,550 support area, while buyers need to reclaim $1,588.61 to $1,600 for stronger upside confirmation. A move above $1,600 would improve the recovery outlook, while a break below $1,548.86 would put sellers back in control.
Before you go: you can learn about the WEEX Token (WXT) for ecosystem participation, and new users may explore the WEEX welcome bonus with limited-time rewards such as trading coupons and task-based incentives.
FAQ
1. What is Ethereum price today?
Ethereum is trading near $1,584.91 on the ETH/USDT spot market, based on the latest WEEX market view in the screenshot.
2. Is ETH bullish or bearish right now?
ETH is attempting a short-term rebound, but it still needs to break the $1,588.61 to $1,600 resistance zone before the setup turns stronger.
3. What is the key support level for ETH?
The main short-term support area is around $1,548.86 to $1,550. A break below that zone would weaken the current rebound.
4. What resistance should ETH traders watch?
ETH traders should watch $1,588.61 first, followed by $1,600. A stronger move above $1,600 could improve the recovery setup.
5. Can ETH recover from here?
ETH can recover if buyers defend the $1,550 area and push price above near-term resistance with stronger volume. Without that confirmation, rebounds may remain fragile.
6. Can I trade ETH on WEEX?
Yes. ETH/USDT is available as a spot market on WEEX, allowing users to buy and sell Ethereum against USDT.
7. What should beginners watch before trading ETH?
Beginners should watch price support, resistance, volume, spread, liquidity, and broader market sentiment before entering a trade.
DISCLAIMER: WEEX and affiliates provide digital asset exchange services, including derivatives and margin trading, only where legal and for eligible users. All content is general information, not financial advice-seek independent advice before trading. Cryptocurrency trading is high risk and may result in total loss. By using WEEX services you accept all related risks and terms. Never invest more than you can afford to lose. See our Terms of Use and Risk Disclosure for details.
You may also like

How to Use DEXTools to Avoid Crypto Scams and Fake Tokens
DEXTools can dramatically cut your risk on decentralized exchanges by surfacing contract red flags, liquidity health, and trading…
DEXTools Pair Explorer Explained: How to Read On-Chain Data Like a Pro
This guide shows you how to use DEXTools Pair Explorer to read on-chain data with confidence. You’ll learn…
BlockDAG Mining Explained: How to Mine BDAG and Is It Worth It in 2026?
This guide breaks down how BlockDAG mining works, the gear options (CPU/GPU or official rigs), expected rewards, and…
BlockDAG Tokenomics Explained: Supply, Distribution and What It Means for Price
This guide breaks down BlockDAG (BDAG) tokenomics—total supply, distribution, halving-style emissions, and vesting—so you can judge potential price…
BDAG Price Analysis: What Is Driving BlockDAG Price Right Now
BlockDAG is a Layer-1 built on DAG architecture, and its BDAG token is trading in a tight band…
How to Use DEXTools to Research a Token Before You Buy
DEXTools helps you evaluate any DEX token before committing capital. This guide shows how to find the right…
What Is DEXTools? The Beginner’s Guide to On-Chain Token Analysis
DEXTools is a real-time analytics platform for decentralized exchanges (DEXs). It helps you research new tokens, track liquidity,…
How to Spot a Rug Pull on DexScreener: Red Flags Every Trader Should Know
Rug pulls thrive in fast-moving memecoin markets, but you can filter many of them in minutes using DexScreener.…
America250 Coin Price Analysis: Is the Hype Still Alive Days Before the July 4 Snapshot?
America250 Coin price analysis 2026: Will the July 4 snapshot trigger a rally or crash? Get the latest America250 Coin price, risks, and post-event outlook.
Mexico vs England Crypto Odds: Azteca Factor and the Divergence Between Traditional and Blockchain Prediction Markets
Mexico vs England crypto odds: Azteca factor narrows the gap. Get match analysis, score predictions, and crypto odds movement for this Round of 16 clash.
SNDK Stock Price Prediction 2026-2030: Can SNDK Stock Reach $3,000 on AI Storage Demand?
SNDK stock price prediction 2026: Can Sandisk reach $3,000? Get analyst targets, key drivers, and learn how to trade SNDK stock on WEEX TradFi 24/7.
DexScreener vs DEXTools: Which Token Screener Is Better for Crypto Traders?
DexScreener and DEXTools are the two most-used token screeners for onchain traders. This guide compares their data coverage,…
How to Use DexScreener to Find New Tokens Before They Pump
This guide shows you how to use DexScreener’s real-time tools—especially the New Pairs tab—to spot fresh listings with…
What Is DexScreener? The Beginner’s Guide to Reading DEX Data in 2026
DexScreener is a free, real‑time dashboard for decentralized exchange (DEX) pairs across dozens of blockchains. This guide shows…
What is Strategy(MSTR) Coin? Everything You Need to Know about MSTR/USDT Perpetual Futures on WEEX
This guide explains what Strategy (MSTR) Coin represents on WEEX, why the MSTR/USDT perpetual futures track equity momentum…
Can MSTR Reach $150 in 2026? MSTR Price Prediction
KEY TAKEAWAYS Current MSTR/USDT futures price: $103.49 at publication time. Required move to hit $150: about +45% from…
SNDK Stock Price Prediction 2030: Can Sandisk Reach $5,000?
Sandisk has become one of the most volatile AI memory and storage-linked stocks. This SNDK stock forecast looks at whether Sandisk can reach $5,000 by 2030, what needs to happen, and which risks traders should watch.
Sandisk Stock Forecast 2026: Can SNDK Recover From $1,843.99 and Reach $3,000?
Sandisk is trading around $1,843.99 after a 7.05% drop, putting the $3,000 target back in focus. This SNDK stock forecast explains the upside math, key support levels, catalysts, and risks for 2026.
How to Use DEXTools to Avoid Crypto Scams and Fake Tokens
DEXTools can dramatically cut your risk on decentralized exchanges by surfacing contract red flags, liquidity health, and trading…
DEXTools Pair Explorer Explained: How to Read On-Chain Data Like a Pro
This guide shows you how to use DEXTools Pair Explorer to read on-chain data with confidence. You’ll learn…
BlockDAG Mining Explained: How to Mine BDAG and Is It Worth It in 2026?
This guide breaks down how BlockDAG mining works, the gear options (CPU/GPU or official rigs), expected rewards, and…
BlockDAG Tokenomics Explained: Supply, Distribution and What It Means for Price
This guide breaks down BlockDAG (BDAG) tokenomics—total supply, distribution, halving-style emissions, and vesting—so you can judge potential price…
BDAG Price Analysis: What Is Driving BlockDAG Price Right Now
BlockDAG is a Layer-1 built on DAG architecture, and its BDAG token is trading in a tight band…
How to Use DEXTools to Research a Token Before You Buy
DEXTools helps you evaluate any DEX token before committing capital. This guide shows how to find the right…